Intro
We continue our analysis of the GCC retail sector. In our previous article, we explored the digital presence of GCC Non-Food Retail, which you can find here. Given the differences in customer behavior and product selection between Food and Non-Food retail, we have divided our research into two parts. This article focuses on GCC Food Retail, which accounts for a significant share of the GCC retail market:
- Food retail will keep growing. According to Alpen Capital, food retail sales are anticipated to increase at a CAGR of 4.9% between 2022 and 2026, while non-food retail sales are forecasted to grow at a CAGR of 6.2%.
- According to Statista, in 2023 food retail sales in the Gulf Cooperation Council countries were estimated at 127.2 billion U.S. dollars. In 2028, the value of food retail sales in the GCC was forecast to reach around 162 billion U.S. dollars.
- The GCC's growing population is expected to reach 59.7 million by 2025, which will drive food consumption and encourage innovation and variety in the food market, driving the food market growth.
- There are some other important factors that shouldn’t be overlooked, such as rising disposable income, GDP growth, urbanization and modernization, expanding food services sector, rise in tourism sector, etc.
As the market expands, competition intensifies, and consumer behavior becomes increasingly digital, food retailers in the GCC must pay special attention to online maps and review platforms. Keeping location details accurate, engaging with customer feedback, and building a strong online reputation can boost foot traffic, enhance brand loyalty, and drive higher sales. With that being said, let’s take a look at GCC Food retailers' digital presence.
Which Food Retailers are going to be analyzed?

Our research examines the online presence of 11 major food retailers across 6 GCC countries, utilizing a comprehensive dataset that includes 3 467 Google Maps locations, 2 656 385 reviews, and 922 789 photos. We chose to focus on the largest food retailers in the GCC by the number of locations, as these companies boast the most extensive networks of offices and branches. This approach enabled us to identify regional trends and ensure representation of all GCC countries.:
- We analyzed the following Food Retail companies: Panda Retail Company, Herfy, Al Othaim Market, Farm Superstores, Carrefour, LuLu Group, West Zone, Al Maya Group, Al Meera, Americana Group, and Nesto
The current state of Google Maps for GCC food retailers presents several opportunities for improvement, as 26% of them lack essential business information. This figure was determined by assessing the completeness of fields like address, coordinates, phone number, category, photos, website, description, and attributes. Furthermore, many retailers are not effectively managing reviews and have numerous unclaimed profiles. However, this is only a small part of the overall issue, so let's explore our research in more detail.
Out of the 3 467 Google Maps locations, 825 or 23.7% are not directly managed by the brand. This lack of direct oversight could result in negative outcomes, such as customers arriving at incorrect locations or times.

The average data completeness is 69%, with food retailers frequently missing key information, such as websites for 744 locations (21.4%) and phone numbers for 543 locations (15.6%). This reinforces the earlier finding that many physical locations are not directly managed by the brand, which can result in customers visiting businesses at incorrect times or addresses, leading to dissatisfaction. Furthermore, many locations lack essential business attributes and descriptions.

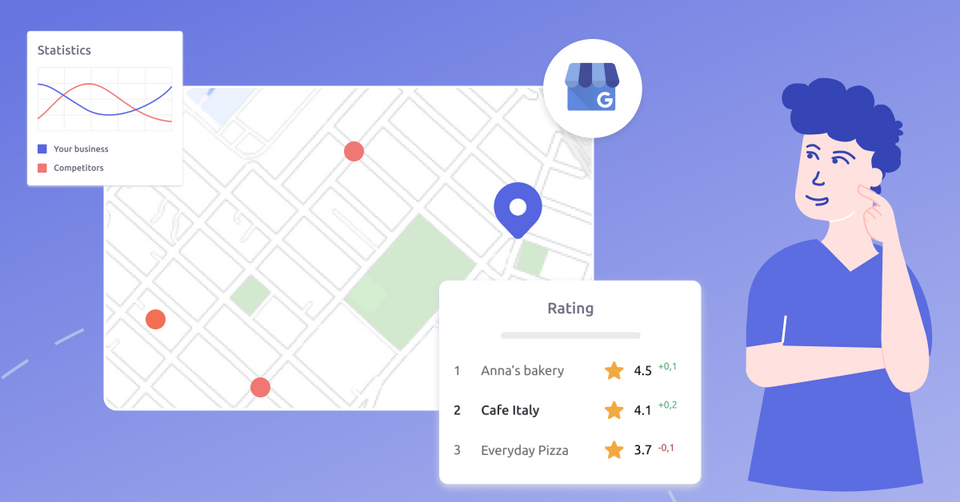
The average rating for the analyzed locations is 4.1, based on 2 656 385 reviews. While this is quite good, 1 299 locations (37.4%) have a rating below 4, and 107 locations (3%) have no rating at all. For those working in local SEO, we recommend prioritizing these locations, as improvements here can lead to quick results and significantly boost the company's search engine visibility. Even a slight rating increase of 0.1 can enhance conversions by 25%. For more information on how to achieve this, we recommend reading one of our articles.

For the locations mentioned above, we identified 922 789 photos, which reflect strong social engagement. However, many of these photos were irrelevant, and we strongly advise companies to pay more attention to this area. Notably, 414 locations (11.9%) have fewer than 3 photos, leading to reduced customer engagement, as locations with updated and relevant photos and videos are viewed 15% more frequently. To improve their online presence, companies should begin by uploading relevant photos and reporting irrelevant ones for removal.
GCC Local Serach Trends for Food Retail
Through a thorough analysis of the statistics mentioned above, we were able to identify local search trends for each GCC country analyzed, including Bahrain, Kuwait, Oman, Qatar, Saudi Arabia, and the United Arab Emirates. These metrics were consolidated into the Geojet Performance Index, which you can check on the map below.
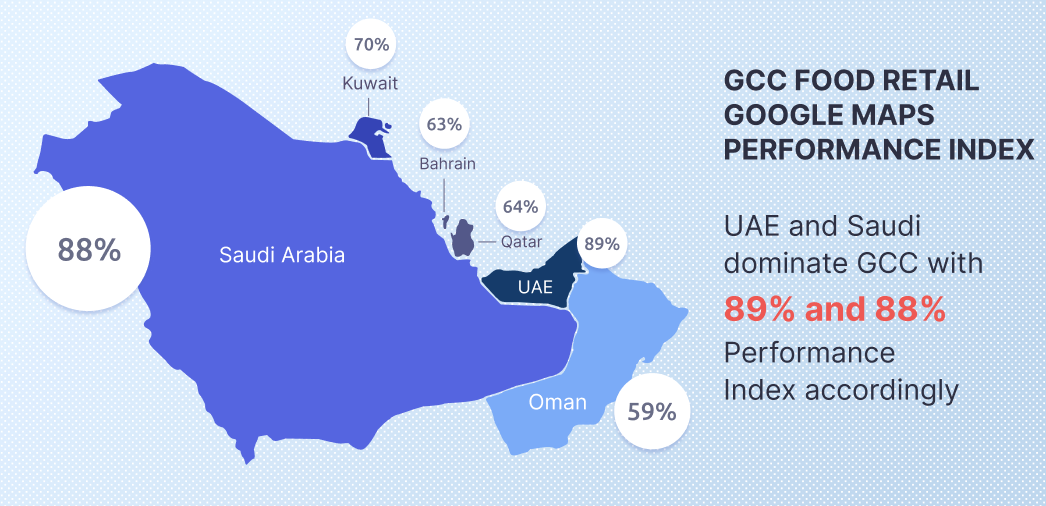
This percentage for Geojet Performance Index was counted by measuring 7 metrics, such as:
- Verified locations
- Data completeness
- Ratings
- Reviews
- Photos
- Amount of locations
- Population
By prioritizing the first 5 metrics, retailers can significantly enhance their Performance Index. Here’s why these metrics are critical and how they can be improved.

- Verified locations play a key role in establishing trust and credibility. Verification assures customers that the provided information is accurate and that the business is authentic. Due to its strong impact on customer confidence and decision-making, this metric holds the highest weight. The leader in verified locations metric is Kuwait with 92% of locations claimed by brands
- Maintaining complete information for each location is crucial in helping customers make informed decisions. Incomplete profiles can lead to confusion and diminish trust. Therefore, data completeness is assigned a high weight to emphasize its significance. The leader in maintaining complete information is the UAE with 72% of food retail companies providing full information about their business.
- Customer ratings directly reflect their experiences and satisfaction levels. High ratings are crucial for building a strong reputation and attracting new customers. While businesses cannot directly control their ratings, this remains a key metric to track and analyze. The leaders in customer ratings are Qatar and Kuwait with 4.1 average rating.
- Customer reviews indicate engagement and provide valuable feedback. However, the quality of reviews has a greater influence than sheer volume. Consequently, reviews are assigned a moderate weight, acknowledging their importance without overstating their impact. That said, actively managing and responding to reviews is essential, as it can significantly influence overall ratings. The leader in customer reviews is Saudi Arabia, which shouldn’t be surprising as it’s the biggest country in the region.
- Photos help customers visualize a retailer’s facilities and services, playing a crucial role in their decision-making process. While important, they represent just one aspect of a retailer’s digital presence. Therefore, photos are assigned a moderate weight to balance their visual appeal with other key informational metrics. However, businesses should still upload relevant images to enhance the customer experience and create a more engaging online presence. The leader in photos is Saudi Arabia with 456 519, which clearly shows high customer engagement.
- Amount of locations is a less influential metric. While retailers should ensure that all their physical locations are listed on online maps, the primary focus should be on maintaining accurate information for each location and actively managing customer reviews.
- Population is the least impactful metric, as it is beyond a retailer’s control. It primarily serves as a contextual factor, helping to balance data analysis across countries with significant population differences, such as Saudi Arabia and the UAE. As such, it should be viewed as a complementary metric rather than a key performance indicator.
Conclusion
Understanding the online presence of food retailers in the GCC is a multifaceted challenge. This study highlights key trends and obstacles by analyzing how Food Retail performs on Google Maps using various metrics. With insights from the Geojet Performance Index, GCC food retailers can now leverage a clear strategy to enhance their visibility and customer engagement on Google Maps. Notably, 6 out of 7 key metrics can be efficiently managed through the Geojet dashboard.
While our research primarily focused on Google Maps, GCC food retailers should also explore other platforms such as Bing Maps and Yango Maps. Yango Maps, in particular, deserves attention, as Yandex, the world’s third-largest search engine, is heavily investing in the region to expand its mapping services with Yango Maps.
When properly managed, online maps become a powerful tool for attracting new customers, optimizing location data, and addressing potential concerns. On the other hand, neglecting map listings and review management can severely impact a brand’s reputation, as this study has demonstrated. We at Geojet know how to leverage and with one of our retail clients, we were able to achieve the following:
- Provide a 52% increase in discovery searches
- Provide a 37% increase in created routes
- Increase site visits by 21%You can check our cases in more details here.
If you would like to see the same results for your business, let us know at [email protected] or contact us in a chat.